
Service Area Profitability Reports: Find Where Home Service Revenue Actually Works
Build This In Joby
Home service companies often expand by drawing a larger circle on a map. More territory can produce more leads, but it can also create longer drives, thinner schedules, higher acquisition costs, and more overtime. A service area is valuable only when the work inside it fits the company's economics and capacity.
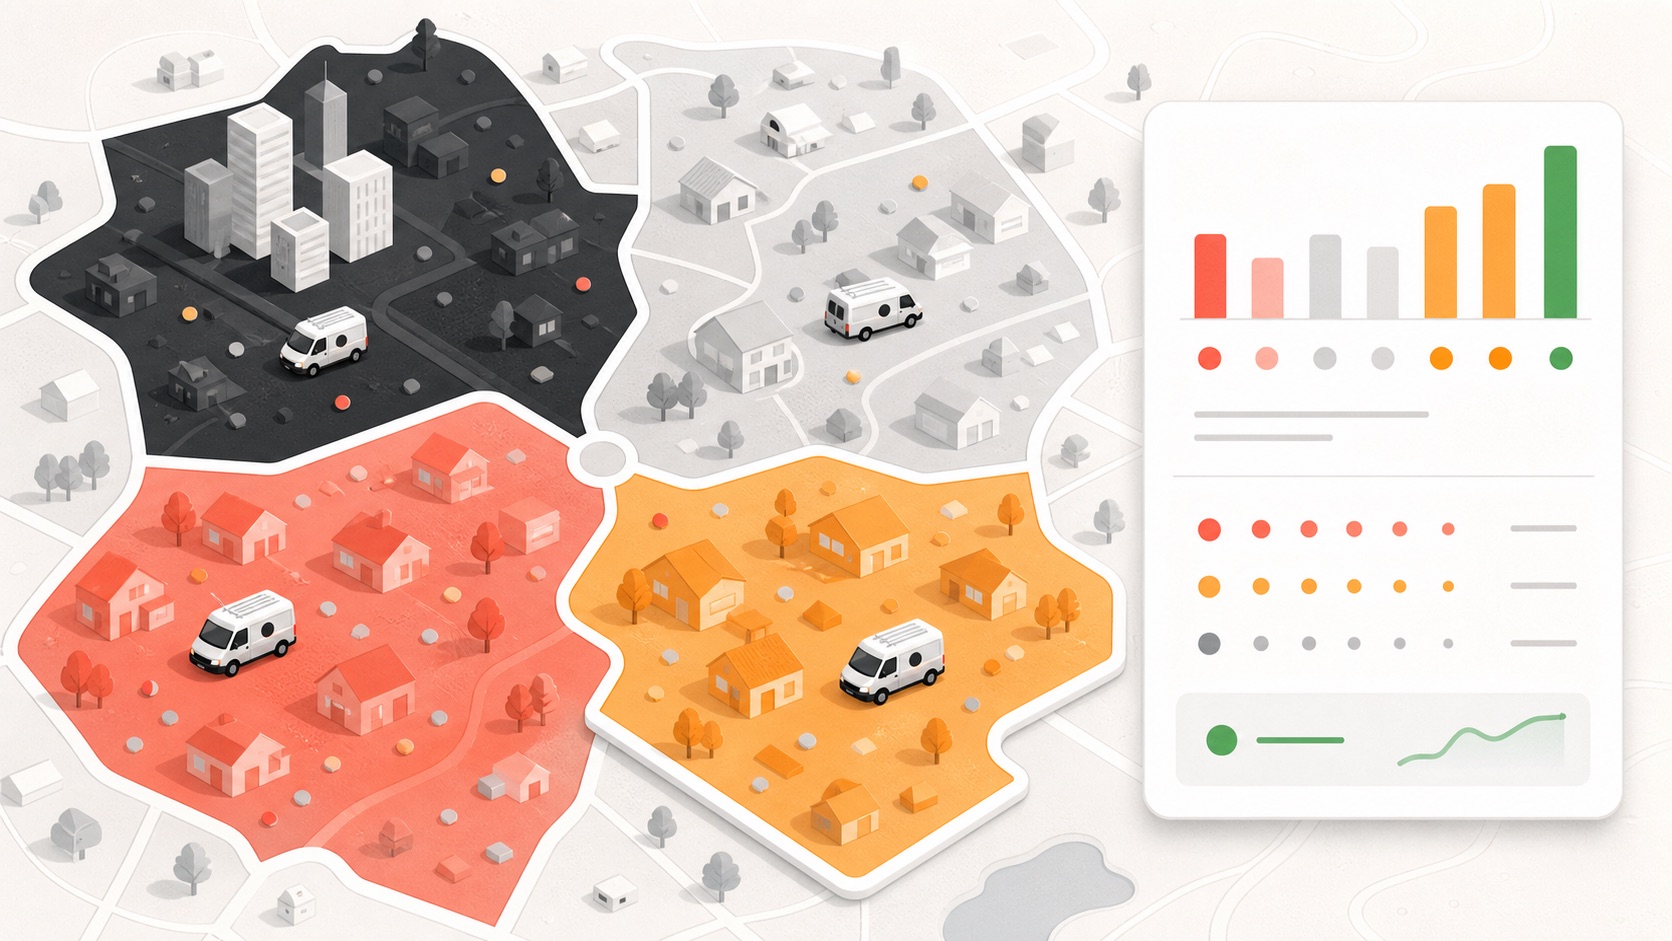
A useful service area profitability report connects geography to inquiries, booked work, completed revenue, direct cost signals, travel burden, callbacks, and collection. It does not pretend that a map alone calculates accounting profit. It gives owners a consistent way to compare zones and investigate differences.
Create stable service-area definitions. Use practical zones that match how the business dispatches and markets: cities, ZIP groups, branches, or custom coverage areas. Avoid changing boundaries every month, or historical comparisons become unreliable. Record out-of-area exceptions separately.
Start with demand quality. Compare lead count, booking rate, estimate rate, approval rate, cancellation rate, and average completed revenue by zone. A territory with many inquiries may still be weak if most are outside scope, price-shopping, or hard to schedule.
Add delivery friction. Review scheduled hours, windshield time when available, late-day overtime, return trips, no-access visits, callbacks, and jobs moved between technicians. Job count without delivery context can make a distant territory look healthier than it is.
Separate revenue from contribution. Completed revenue is a starting point. Compare discounts, refunds, payment fees, labor and material inputs where the business tracks them, and warranty work. Finance should define which costs belong in the report and how shared overhead is handled.
Normalize for mix and season. One zone may contain more installations while another produces repair calls. Compare like services, similar ticket sizes, and the same date range before making a territory decision. Use rolling periods so a single storm or promotion does not dictate strategy.
Review capacity before cutting or expanding. Low volume may mean weak demand, or it may mean the team rarely offers appointments there. High revenue may conceal an overloaded technician group. Pair the report with schedule capacity, skill coverage, and customer wait time.
Turn findings into controlled tests. Adjust one lever at a time: marketing spend, minimum ticket policy, appointment days, technician coverage, or services offered. Define the expected result and review it after a meaningful period. An observational report alone does not prove causation.
How Joby supports the workflow. Joby's service-area, lead, job, payment, dashboard, and reporting surfaces help teams compare volume, conversion, and revenue by geography while keeping the underlying context nearby. The business remains responsible for cost allocation and profitability definitions.
The bottom line. Stable zones, consistent definitions, demand quality, delivery friction, and capacity context make geographic reporting actionable. Expand where the operating model works, investigate where it does not, and test changes before redrawing the map.


